Synthetic Range Profiling using the IFFT Approach
Richard T. Lord and Michael R. Inggs
Radar Remote Sensing Group, Dept of Electrical Engineering,
University of Cape Town
Private Bag, Rondebosch 7701, South Africa
Tel: +27 21 650 2799 Fax: +27 21 650
3465
Email: rlord-avoidspam@ebe.uct.ac.za
Note --- This paper has been published at the Igarss'96 conference.
A pdf version of this paper can be downloaded here: igarss96.pdf
Abstract --- This paper demonstrates the use of stepped-frequency
waveforms to obtain high resolution SAR images without imposing severe
instantaneous bandwidth requirements on the radar system. Although
azimuth compression and motion compensation are essential to obtain high
resolution SAR images, this paper only discusses how to obtain high range
resolutions. Especially at VHF frequencies it is very difficult to
obtain high range resolutions, because the effective pulse bandwidth required
would amount to a large percentage of the centre frequency. After
briefly introducing the theory of synthetic range profiling as applied
to SAR, this paper goes on to discuss the synthetic range profile of an
A320 airbus, which serves to demonstrate the feasibility of synthetic range
profiling. More attention is then given to simulation results, which
introduce the problems encountered when sampling the returning echo waveforms.
I. Introduction
Synthetic range profiling (SRP) is a processing technique to
obtain high range resolution using stepped-frequency waveforms without
imposing severe instantaneous bandwidth requirements on the radar system.
A total radar bandwidth of 64 x 1.5 = 96 MHz can be synthesized by sequentially
transmitting 64 pulses, each pulse stepped in frequency by 1.5 MHz.
The final slant-range resolution that can therefore be achieved is about
1.56m.
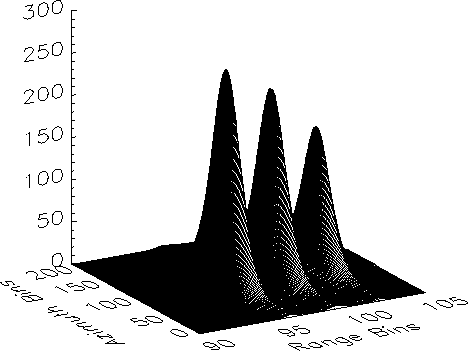 Figure 1: Surface plot of three point targets that were
resolved using synthetic range profiling.
Figure 1: Surface plot of three point targets that were
resolved using synthetic range profiling.
This is illustrated in Fig. 1, which shows a surface
plot of three point targets that were resolved using SRP. These simulated
point targets, which were 6m apart in ground range, were "illuminated''
with 64 monochrome pulses stepped in frequency, each pulse having a bandwidth
of 1.5 MHz, which corresponds to a slant-range resolution of only 100m.
However the use of stepped-frequency processing yielded a final slant-range
resolution of 1.56m.
The CARABAS system is a practical example of an airborne SAR system
which operates in the lower part of the VHF-band to produce surface images
using stepped-frequency waveforms [2].
II. Synthetic Range Profiling Applied to SAR
To produce SAR images with stepped-frequency waveforms basically requires
the production of one SRP per coarse range bin. Obtaining
a SRP involves the following steps [5]:
-
Transmit a burst of n pulses, each pulse shifted in frequency by
a fixed frequency step size
 .
.
-
Collect one I and Q sample of the target's baseband echo
response in each coarse range bin for every transmitted pulse. These
samples are the frequency-domain measurements of the target's spectral
profile.
-
Apply an inverse discrete Fourier transform (IFFT) on the n complex
samples in each coarse range bin to obtain an n-element SRP of the
target in the respective coarse range bin.
In contrast with data obtained from pulse-compression radars, the data
is already compressed in the range direction at this stage, since the slant-range
resolution has been obtained synthetically using the inverse discrete Fourier
transform. The azimuth resolution, however, can be obtained as in
pulse-compression radars by coherently integrating the range-resolved echo
signals that were obtained during the real beam dwell time. This
aspect is not addressed in this paper. Furthermore, to obtain high
resolution images, motion compensation and range curvature would have to
be addressed as well. Another problem not discussed in this paper
is the variation of the radar response with frequency and observation angle
[1], which varies significantly over the synthetic aperture
path.
The synthetic slant-range resolution is given by

and the slant-range ambiguity length is given by

Ideally the matched filter integration length, given by  , where
  is the pulse length, should equal the slant-range ambiguity length
  . This leads to a pulse length of

When the integration length is greater than
, foldover will occur due to integration of scatterers outside the unambiguous
range length. However if the integration length is smaller than
, the echo signal will only contain energy integrated from a range depth
smaller than the slant-range ambiguity length.
III. Synthetic Range Profiles of Aeroplanes
The feasibility of using stepped-frequency waveforms to produce high
resolution down-range profiles has already been demonstrated by the production
of SRPs of aeroplanes [4]. Fig. 2
shows the SRP of an A320 airbus that has been produced by transmitting
linear chirp pulses at 55 different frequencies at L-Band. Two pulses
were transmitted at each frequency in order to carry out moving target
indication (MTI) processing. Each pulse had a bandwidth of 3.6364
MHz, which resulted in a compressed pulse width of  ns. The pulse resolution was therefore
  m, which is about the length of a large aircraft.
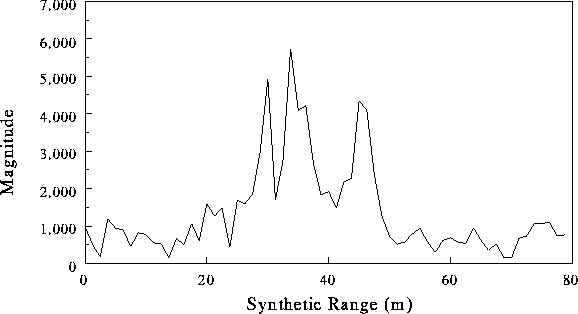 Figure 2: Synthetic Range Profile of an A320 airbus.
The frequency spacing was 1.875 MHz, which corresponds to a range-delay
extent of 80m, which is about twice the length of the pulse resolution.
The total processed radar bandwidth was 103.125 MHz, which results in a
slant-range resolution of 1.45m.
IV. Simulation Results
Table I gives the parameters that were used to obtain the simulated
SAR data.
Table I: Parameters of radar using SRP
| Frequency Step Size |
|
1.5 MHz |
| Number of Steps |
n |
64 |
| Start Frequency |
 |
90.75 MHz |
| Stop Frequency |
 |
185.25 MHz |
| Total Radar Bandwidth |
B |
96 MHz |
| Slant-Range Resolution |
 |
1.56 m |
| A/D sampling frequency |
 |
1.5 MHz |
| Coarse Range Bin Size |
 |
100 m |
| Pulse Length |
|
666.67 ns |
| Pulse Repitition Frequency |
PRF |
11.52 kHz |
Fig. 3 shows the magnitude along a range line
of a single resolved point target.
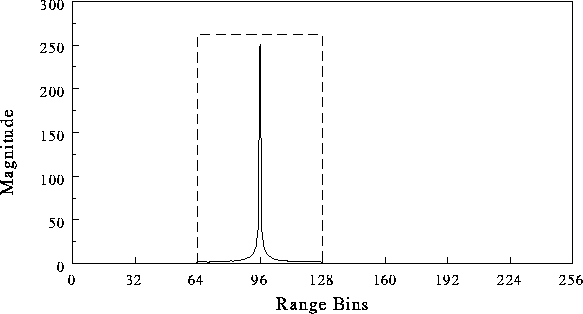 Figure 3: Synthetic range profile of a single point target
in one coarse range bin.
Figure 3: Synthetic range profile of a single point target
in one coarse range bin.
The dashed line indicates the coarse range bin in which the point target
is situated. Samples were collected in four successive coarse range
bins, each bin having a slant-range extent of 100m (corresponding to a
667ns pulse). Note that the instantaneous bandwidth and the A/D sampling
frequency required are only 1.5 MHz, compared with the final processed
bandwidth of 96 MHz. The original PRF of 180Hz was increased by a
factor of 64, giving a final PRF of 11.52kHz. A radar mounted on
an aircraft which flies at a height of 10km, mapping out a 4km wide swath
in slant range, requires a PRF of less than 37.5kHz to avoid ambiguity
problems. However if it is required that one pulse has to be received
before the next pulse is transmitted, this increase in PRF will be unacceptable.
The technique of multiple PRF ranging [3 pg.
116] may be used to solve this problem.
In Fig. 4 a range line displaying three resolved
targets is shown. The important thing to note in Fig. 4
is the spill-over of energy into the successive range bin. The next
section discusses this problem in more detail.
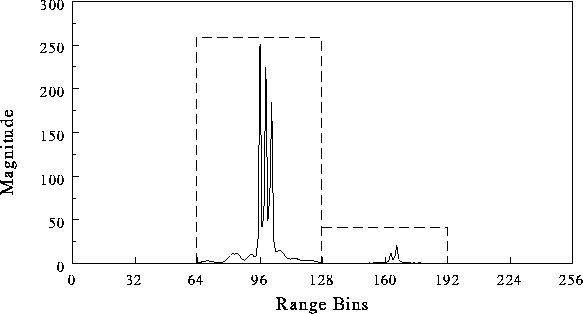 Figure 4: Synthetic range profile of three point targets
in one coarse range bin,
showing spill-over of energy into successive range bin.
Figure 4: Synthetic range profile of three point targets
in one coarse range bin,
showing spill-over of energy into successive range bin.
V. Sampling Criteria
Fig. 5 shows that for a single point target it
is possible to avoid spill-over of energy into the successive range bin
by sampling the matched filter output exactly at the peak of the triangular
waveform. This scenario was followed when the data of Fig. 3
was produced. However as soon as there is more than one point target
(which is the case in practice), there will be an inevitable spill-over
of energy into the next range bin, as illustrated in Fig. 5.
Sampling still takes place at the theoretical peak of the first pulse,
but some of the energy of the second pulse and even more energy of the
third pulse is also sampled in the next coarse range bin. This explains
the decrease in amplitude of the second and third pulse as seen in Fig.
4.
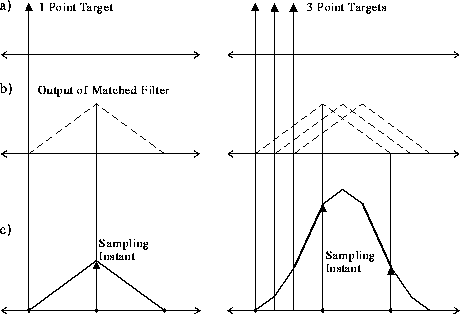 Figure 5: Sampling the output of the matched filter.
A solution to the problem of spill-over of energy would be to sample
every second coarse range bin during one transmitted pulse, and then every
other second coarse range bin during the next transmitted pulse.
This, however, will increase the PRF by a factor of two. Further
investigations are being carried out using windowing functions and overlapping
coarse range bins, in order to arrive at a satisfactory solution regarding
the sampling of returning waveforms.
VI. Skipping Frequencies
An important advantage of using stepped-frequency waveforms is the
capability of skipping certain frequencies that would otherwise be corrupted
by external sources such as broadcast FM and mobile radio. Before
transmitting a pulse, the receiver could predict how much interference
there will be at a particular frequency, and then decide to skip that frequency.
Since the order in which frequencies are transmitted is not important,
the radar could try to transmit a skipped frequency at a later stage in
the burst. Another way out would be to interpolate the I and
Q values of skipped pulses from those I and Q values
of surrounding pulses.
VII. Conclusions
The results that have been obtained from simulated SAR data show that
it is feasible to use stepped-frequency waveforms to produce high resolution
VHF SAR images. Not only do stepped-frequency waveforms alleviate
the instantaneous bandwidth requirements of the radar system, but they
also offer the capability of skipping frequency regions that might be polluted
by external sources. This is expected to be a major feature of such
a system, since the amount of interference at the VHF band is expected
to be quite severe.
Further work will have to be carried out to investigate the effects
of interpolating missing pulses, to solve the problems of the matched filter
effect satisfactorily, to investigate the use of multiple PRF ranging and
to implement high resolution SAR azimuth processing.
References
-
S.R.J. Axelsson, "Frequency and Azimuthal Variations
of Radar Cross Section and Their Influence Upon Low-Frequency SAR Imaging,''
IEEE Trans. on Geoscience and Remote Sensing, vol. 33, no. 5, pp. 1258-1265,
September 1995.
-
A. Gustavsson, P.O. Frölind, H. Hellsten, T. Jonsson,
B. Larsson and G. Stenström, "The Airborne VHF SAR System CARABAS,''
Proc. IEEE Geoscience Remote Sensing Symp., IGARSS'93, Tokyo, Japan, vol.
2, pp. 558-562, August 1993.
-
S.A. Hovanessian, Radar System Design and Analysis,
Norwood, MA 02062: Artech House, 1984.
-
A.D. Robinson and M.R. Inggs, "Correlation Filters Applied
to Synthetic Range Profiles of Aircraft Targets,'' Proc. of the IEEE South
African Communications and Signal Processing Symp., COMSIG'94, October
1994.
-
D.R. Wehner, High Resolution Radar, Norwood, MA 02062:
Artech House, 1987.
Return to Richard Lord's Homepage.
