Airport measurements: Processed results
Prepared by: Alan Langman
Gordon Farquharson
Prepared for: Prof Hugo
Date: 19-Oct-1998
Introduction
This report presents the processed results of the two sets of grid measurements (pline and cline) taken at the Cape Town International airport. The objective of the processing was to attempt to extract features from the radar images that correlated with the water content in the runway.
Expected radar returns
The presence of water in the runway will result in changes in the electrical permittivity of the layers that constitute the runway. This will result in two different (yet related) effects on the radar images.
The increase in water content in the layer increases its permittivity, and hence one would expect a greater return from the layer with water than without (increased dielectric contrast).
Secondly, changes in water content above a layer will result in that layer having different observed depths below the surface (assuming a constant permittivity in the processing).
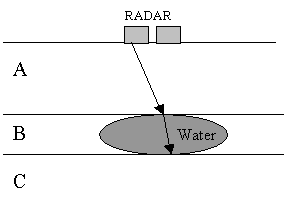
These effects will be coupled. To understand this consider the figure below. If we have three layers in the medium – media A,B and C. Assuming that layer B is saturated with water at a position x meters from the start of the measurements.
As one traverses across the surface the reflections from the interfaces between layers A and B should increases as one moves over the water saturated area in layer B. At the same position the measured depth of layer C should increase (given that we process the data with a constant permittivity).
It is also important to note that the resolution of the radar is 15cm in free space. This decreases as the permittivity of the ground increases. If we assume that the permittivity of the medium is 9 then the radar resolution should have a theoretical value of 5cm. This will decreases due to dispersion (in both the medium and the antenna to 8-10cm). This is an important consideration since the depth of the layers of interest are 130mm and >200mm (as measured from the core samples). So we do not expect a well defined clear image. This presents a problem for automatic processing.
Another important fact to consider is that the radar images are not absolute and hence can lead to ambiguous interpretations. This is simply as a result of the one-to-many mapping of the observed radar images to ground truth. These ambiguities can be resolved using information available about the medium being probed.
For example the changes in depth of the lower layer can be caused either by changes in permittivity or physical reality of the layer. Knowledge that the layer must be flat resolves this ambiguity.
Processed Results
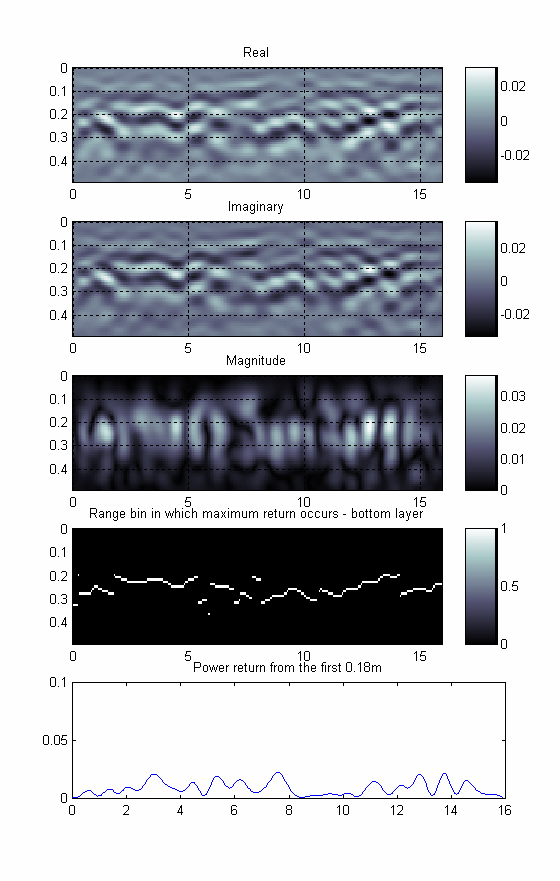
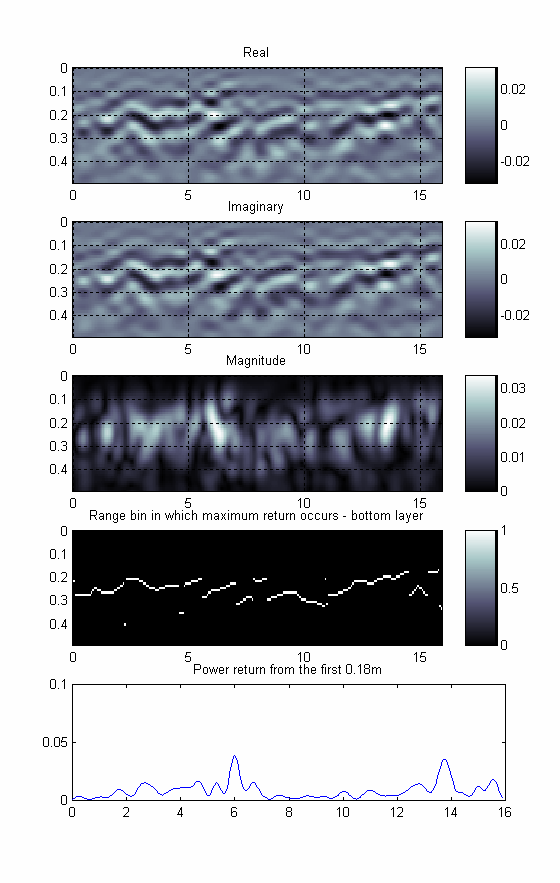
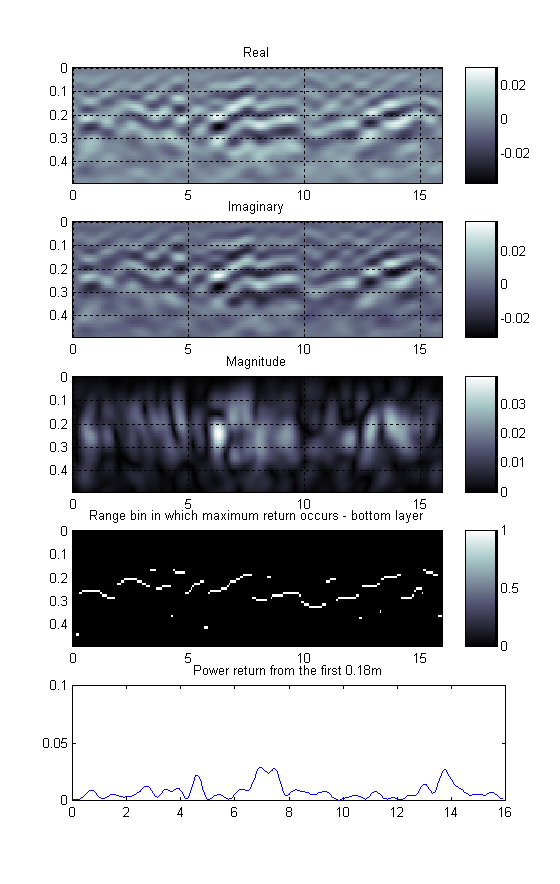
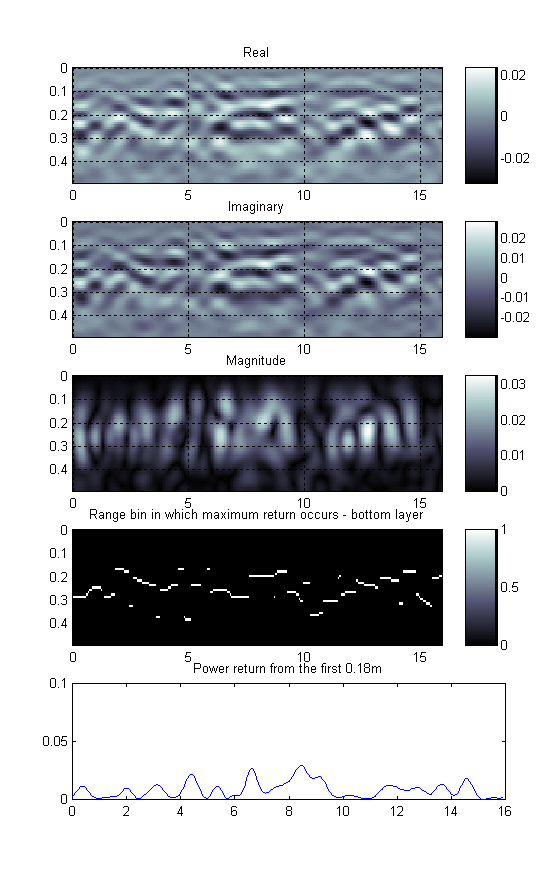
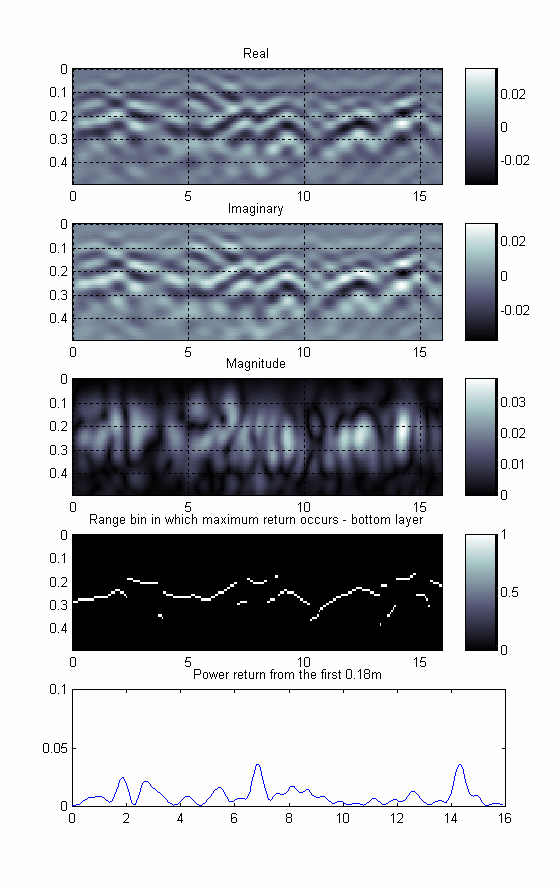
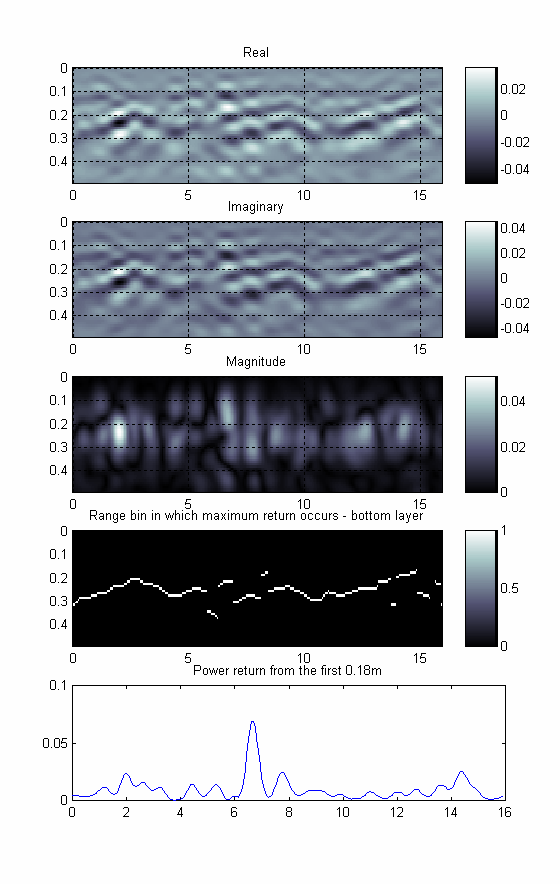
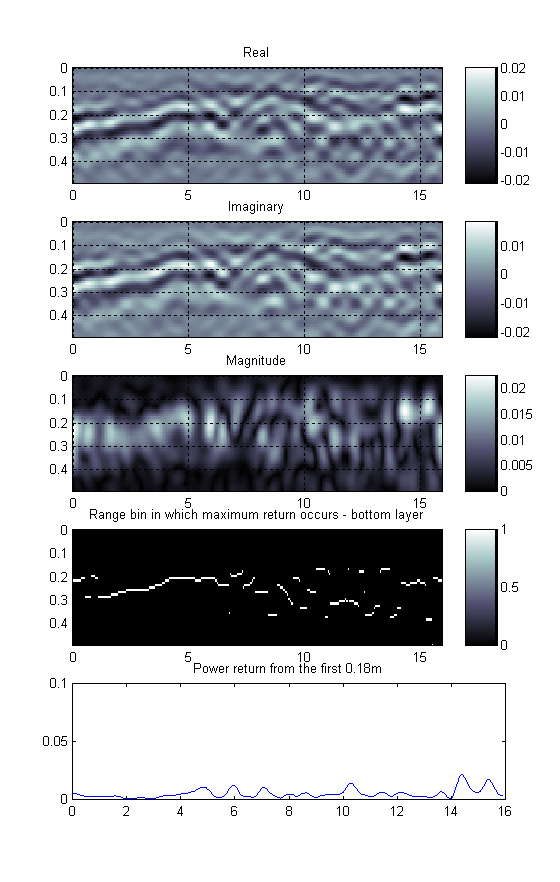
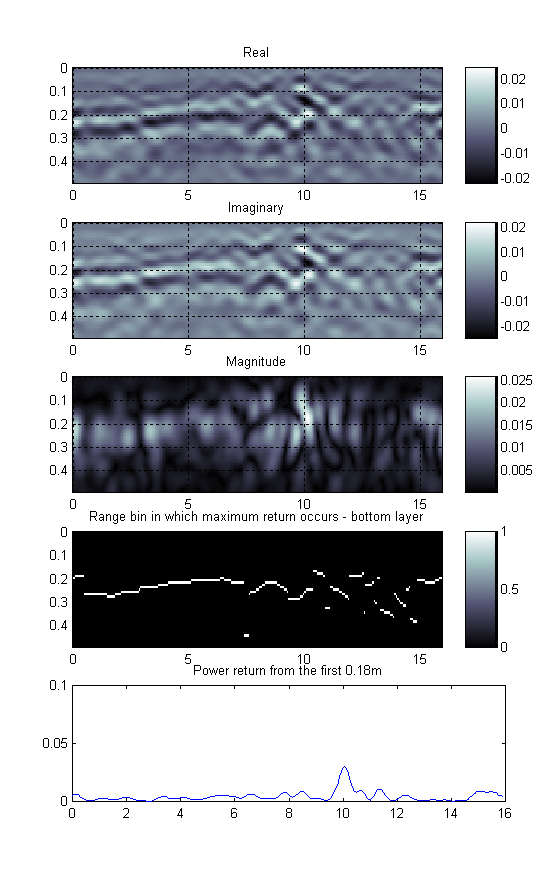
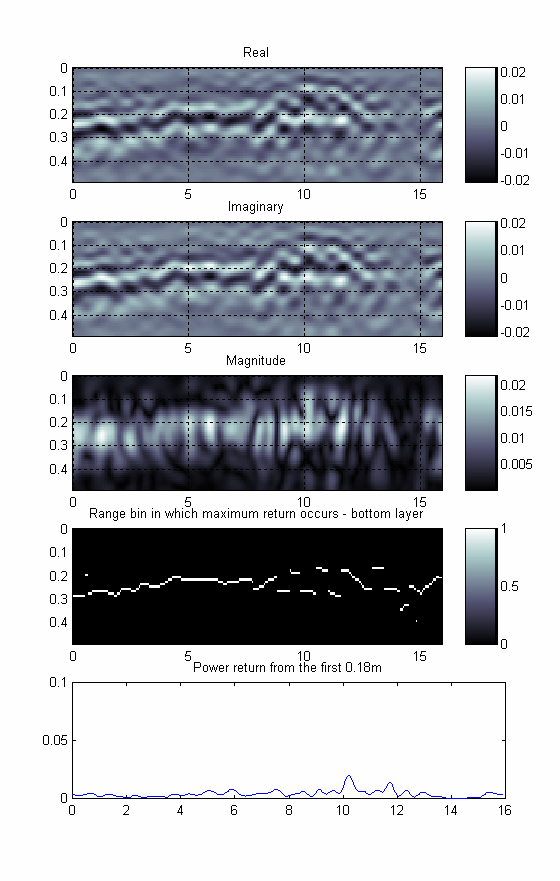
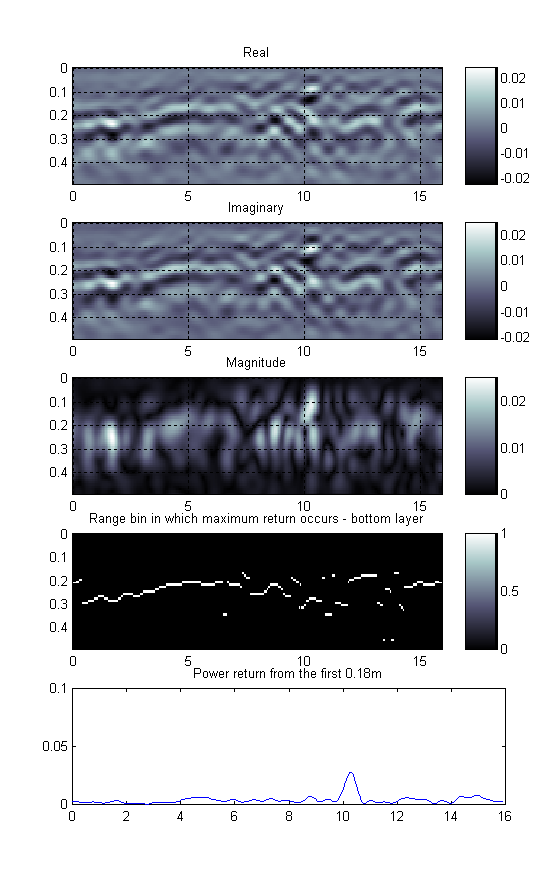
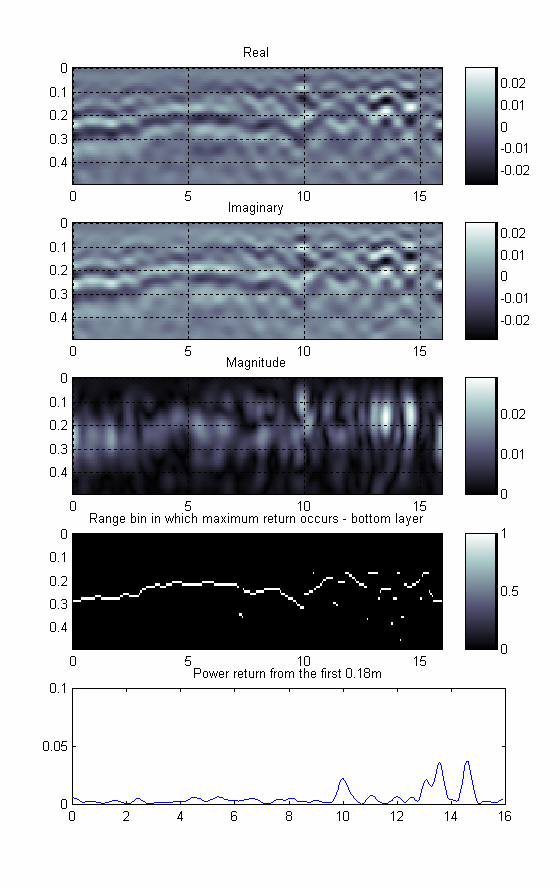
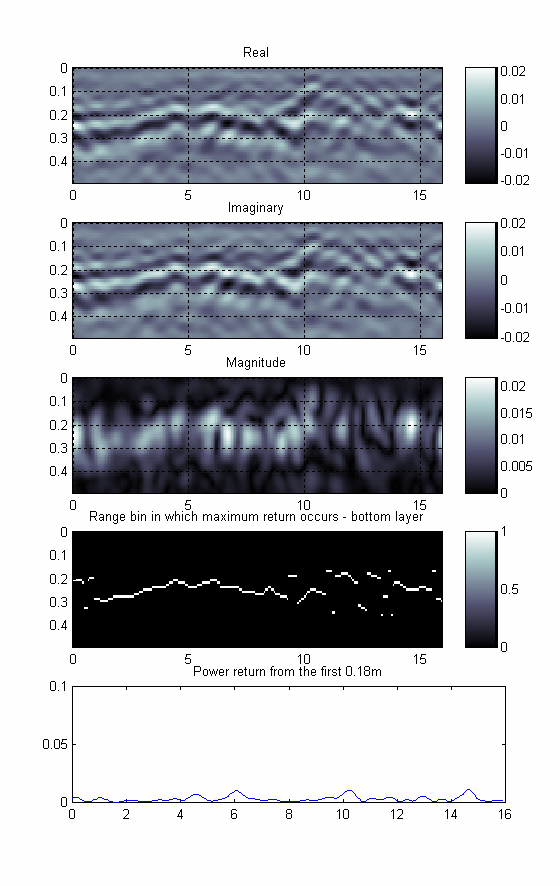
Figures 1-12 show the processed results of the grid slices of the pline and cline regions on the runway. Each figure presents five different processed results. All processing assumes that the medium has an average premittivity of 9. These processed results include the following information (in order as they appear in the figures).
A careful look at the real and imaginary components of the radar spatial response, suggest that there are two layers visible. The first layer (in most images) has a much smaller amplitude than the second layer. However there are regions where this amplitude increases (consider Figures 7-9). At the same place the lower layer depth decreases. This could suggest that there is water in these regions – depending on the structure of the underlying layers.
It is important to note that, the real an imaginary radar response do not provide a true resolution of the radar. Each pulse is (ideally) represented by a wavelet. Hence a layer would consist of three colour bands i.e. center white band with a black band on either side. This image format allows one to see more layer details than the magnitude response – as can be seen in all of the figures. In fact it is very difficult to see the layers in the magnitude radar response.
The second last image in each figure represents a simplistic attempt to extract the bottom layer from the radar image. The idea is to relate this bottom layer to the water content above the layer by noting its deviation from the true depth of the layer. This technique does not work well when there are other maxima in the image. The kayer can be enhance by linear and non-linear filtering. This can be combined with the realistic physical discontinuities that one expects due to the water content. One could probably limit the observable slope of the layer to filter out peaks from other reflections in the image. This processing still needs to be improved. However the basic idea is demonstrated as is seen in the processed results.
The final plot in each figure shows the power reflected from the first 0.18m below the runway surface. Since certain core samples have revealed that the layer at 0.18m is sometimes saturated with water, it is assumed that this will result in more energy being reflected from these images. Peak can be observed in some of the figures – however these still need to be related to the core samples.
Conclusions
From the results it seems as if it is possible to correlate water and the measured radar images. However it does not seem that there is a simple method that can produce surface plots that can definitely show the location of water. In the various reports presented we have considered three methods to achieve this:
Recommendations
It is believed that the radar can provide a valuable aid in determining the location and nature of the underground water in the runway. However it seems that the most effective way to achieve this would be to extract information manually from the real and imaginary images of the radar. The processing can be used – but it still needs to be checked with core samples.